Live River Flows and Rainfall Viewer released
Author: John Gibson
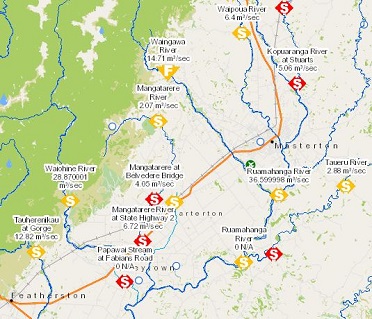
A new Live River Flows and Rainfall Viewer has been released for the Wellington Region. This allows you to quickly gain an overview of current river conditions and active rainfall.
All GWRC live monitored sites for the region are visible in one place, using a simple set of icons to show the conditions. See the Environmental Science information page for background.
Individual site records can be accessed by clicking on the map icons. For full information about a site we recommend you view the graph.
Below is an example image showing the location of a river gauging station at Kaitoke Weir (courtesy GWRC)
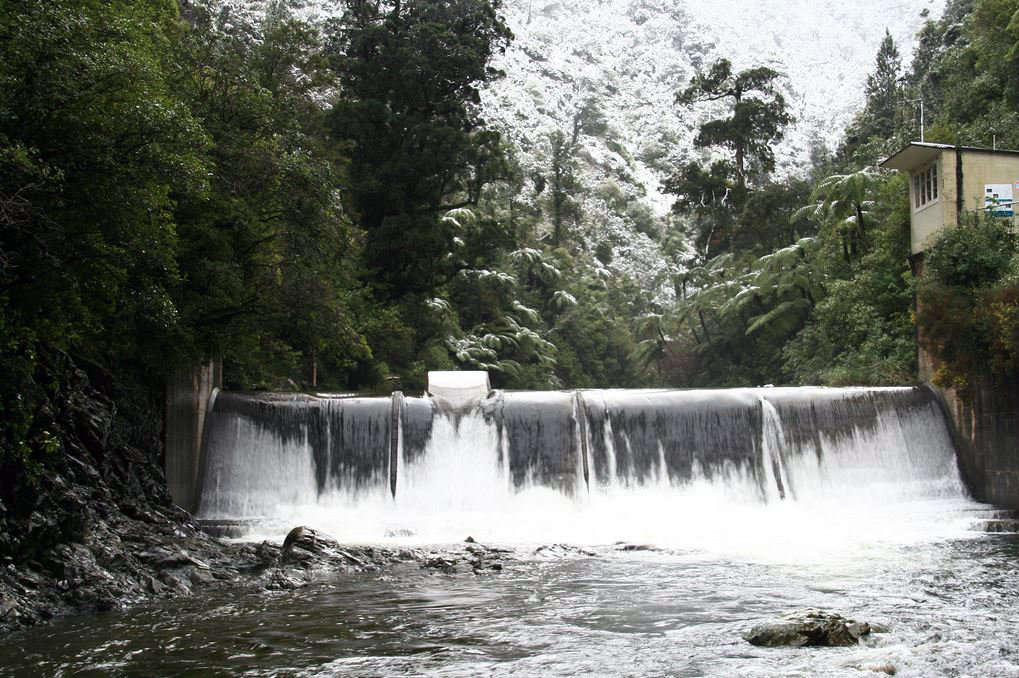
GWRC Environmental Science Team measures river/stream flows and levels at 45 sites throughout the region. Water levels are monitored continuously at all stations and water temperature is monitored at selected sites. The data are logged on a regular basis (usually every 15 minutes) and then uploaded to our database via radio or cell phone transmission every 2 to 3 hours.
The measurements are stored and where necessary transformed on the database, known as Hilltop.
Measurements are then made available through web services for reuse. The main service types supported are Hilltop REST and SOS. For use in the mapping viewer, services are aggregated and transformed to ESRI REST format. River flow and rainfall services are available through the GWRC map services directory.
For more information, please contact us.
Location map layers are also available for download from the GWRC Open Data Site.
Further information on the region's environment can be found on the Land Air Water Aotearoa (LAWA) Site.
Published: 21/08/2017 Updated 21/08/2017