Climate Change Data Viewers released
Author: John Gibson
A new set of climate change mapping tools have been released for the Wellington Region. The tools are based on data supplied by NIWA as part of a report commissioned by GWRC. The tools reveal the projected future of climate change in the region – including a marked increase in days over 25 degrees in the Wairarapa and stronger wind and rain in Wellington city.
The tools are in the form of an interactive viewer showing all available data layers, and also a Story Map viewer showing more detailed information about a subset of key data layers.
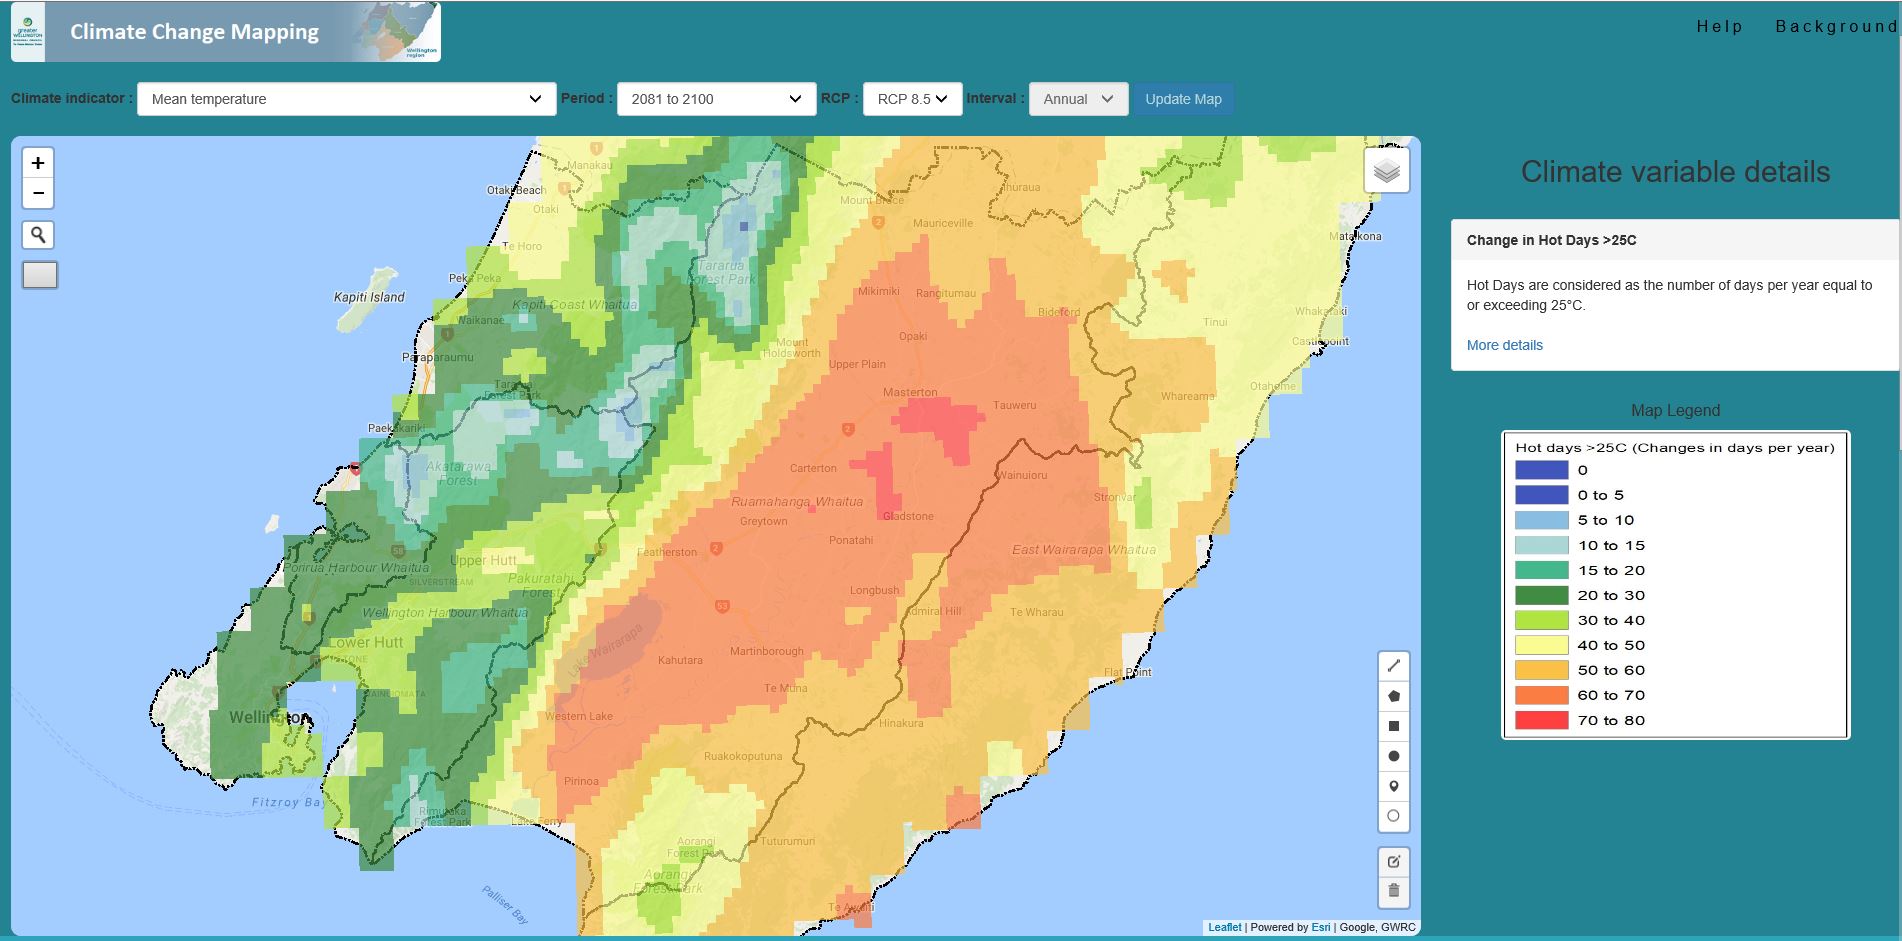
Based on the Intergovernmental Panel on Climate Change’s (IPCC) New Zealand climate model data, the viewers display a range of climate change scenarios in the Wellington region until the year 2100. With over 500 layers of data, the interactive viewer provides an ‘on the spot’ assessment of climate change for 21 climate variables, including drought potential, growing degree days for crops, soil moisture, and several rainfall, temperature and wind thresholds. It also includes a range of greenhouse gas emissions scenarios.
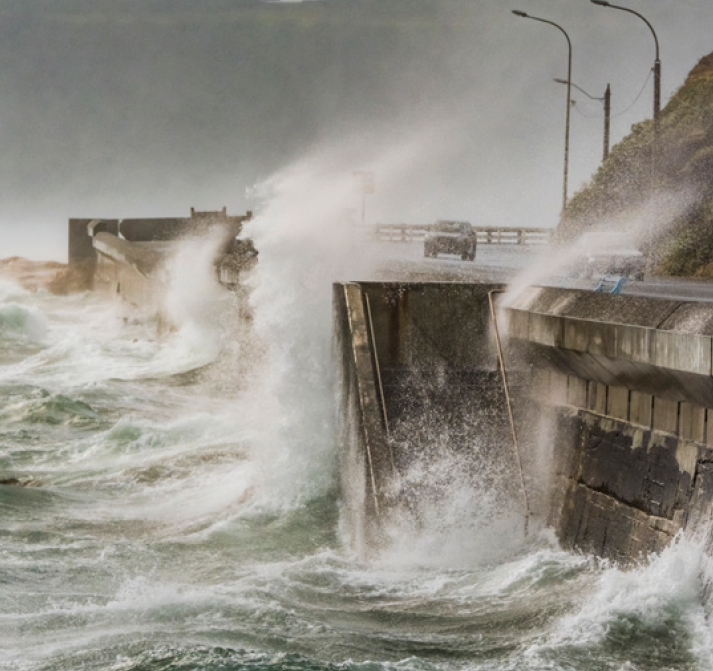
The Council is currently working with NIWA to understand what additional insights could be gained in terms of climate extremes. “It is when the extremes hit that we really become more aware of what’s happening, and when our resilience is tested. The web mapping is only an initial step. The next step will be to identify the risk and vulnerability to communities and infrastructure as we change and adapt,” says Dr Alex Pezza, Senior Climate Scientist at GWRC.
Background information is available through the GWRC Climate Change pages, and a summary report is available from NIWA
Map layers are available for reuse as services from the GWRC map services directory
For more information, please contact us.
Published: 1/10/2018 Updated 1/10/2018