Sea Level Rise Data Viewers released
Author: John Gibson
A new set of sea level rise mapping tools have been released for the Wellington Region. To help support our communities prepare for climate change, we have launched a fully integrated sea level rise (SLR) and storm surge map viewer, as a separate suite, to accompany the climate change maps that have already been around for a while.
The context for these maps is described in an article in Stuff.
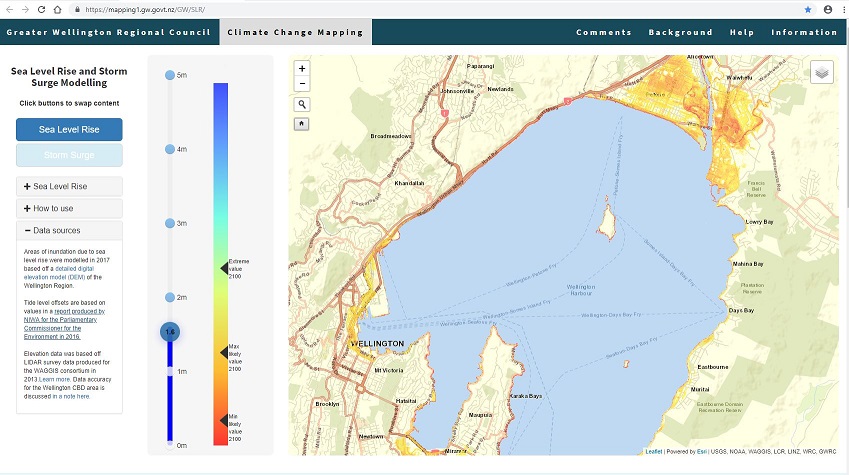
The SLR viewer uses high resolution terrain mapping (LIDAR data), and the latest storm surge modelling available by NIWA to illustrate the extent of inundation under various scenarios. The tool is very easy to use, with capability of displaying sea level rise between zero and 5 metres above the current level for the entire region.
The scale bar that accompanies the map points to the “likely” minimum and maximum levels, as well as extreme maximum values, predicted to by the end of the century by the National Oceanic and Atmospheric Administration (NOAA) in the United States. The presented range, however, is not a formal prediction. While we know that the sea level is going to rise, we don’t know how fast this is going to happen, even though there is a high likelihood that at least the minimum levels of predicted SLR will be realised by 2100.
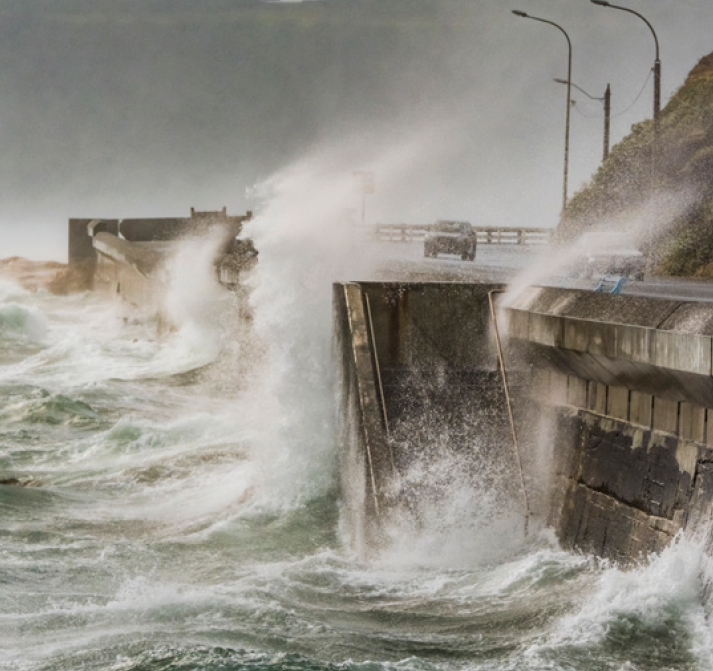
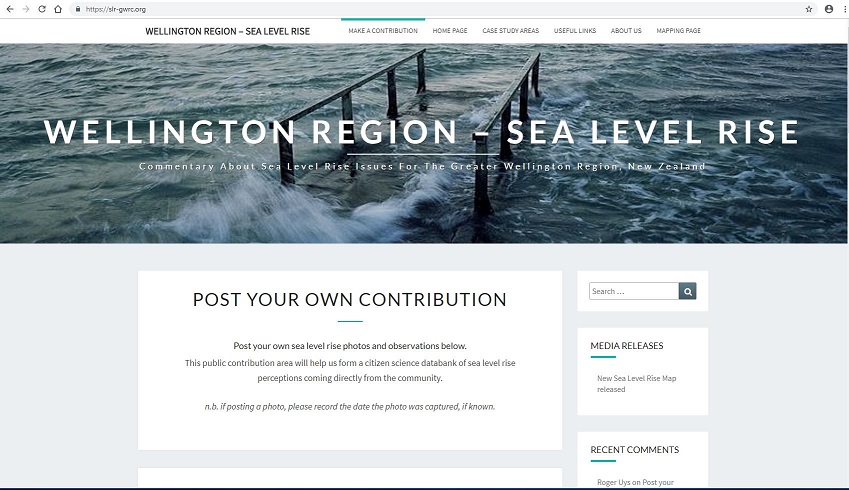
Along with this tool, we have also developed a blog site to encourage the public to submit their observations and photographic evidence of sea level rise impacts. We really wanted to encourage people to contribute to the blog as form of citizen science. If we have a large number of community members, who might live on the coast, sharing their views and photos, it would be possible to create a community-based databank of existing perceptions out there.
This new development should give the community a much needed tool to help start a conversation about the impacts of sea level rise around our Region, while encouraging a citizen science perspective with our stakeholders. This mapper is the first stage of a wider national approach. We are in touch with other Regional Councils, CRIs and Universities, working together to eventually be able to have a joint release of a mapper covering the entire country, using a unified methodology.
Background information is available through the GWRC Climate Change pages, and a background report prepared by NIWA is available from the PCE.
Map layers are available for reuse as services from the GWRC map services directory
For more information, please contact us.
Published: 6/06/2019